Regular readers of this blog, and indeed the news media, will be aware that there has recently been some scrutiny of the work of Dr. Brian Wansink, Director of the Cornell Food and Brand Lab. We have seen what appear to be impossible means and test statistics; inconsistent descriptions of the same research across articles; and recycling of text (and even, it would appear, a table of results) from one article or book chapter to another. (Actually, Dr. Wansink has since claimed that this table of results was not recycled; apparently, the study was rerun with a completely different set of participants, and yet almost all of the measured results—17 out of 18—were identical, including the decimal places. This seems quite remarkable.)
In this post I'm going to explore some mysterious patterns in the data of three more articles that were published when Dr. Wansink was still at the University of Illinois at Urbana-Champaign (UIUC). These articles appear to form a family because they all discuss consumer attitudes towards soy products; Dr. Wansink's CV here [PDF] records that in 2001 he received $3,000 for “Disseminating soy-based research to developing countries”. The articles are:
Wansink, B., & Chan, N. (2001). Relation of soy consumption to nutritional knowledge. Journal of Medicinal Food, 4, 145–150. http://dx.doi.org/10.1089/109662001753165729
Wansink, B., & Cheong, J. (2002). Taste profiles that correlate with soy consumption in
developing countries. Pakistan Journal of Nutrition, 1, 276–278.
Wansink, B., & Westgren, R. (2003). Profiling taste-motivated segments. Appetite, 41, 323–327.
http://dx.doi.org/10.1016/S0195-6663(03)00120-X
For brevity, I'll mostly refer to these articles by the names of their co-authors, as "Chan", "Cheong", and "Westgren", respectively.
Chan describes a study of people's attitudes towards "medicinal and functional foods such as soy". It's not clear what a "functional food"—or, indeed, a "non-functional food"—might be, and it might come as a surprise to people in many Asian countries who have been consuming soy all their life to hear it described as a "medicinal food", but I guess this article was written from an American perspective. Exactly what is categorised under "soy" is not made clear in the article, but one of the items asked people how many times in the past year they purchased "tofu or soy milk", so I presume we're talking about those kind of soy products that tend to be associated in Western countries with vegetarian or vegan diets, rather than soy sauce or processed foods containing soy lecithin.
Of interest to us here is Table 2 from Chan. This shows the responses of 770 randomly-selected Americans, split by their knowledge of "functional foods" (apparently this knowledge was determined by asking them to define that term, with the response being coded in some unspecified way) to a number of items about their attitudes and purchasing habits with respect to soy products. Here is that table:

The authors' stated aim in this study was to see whether "a basic (even nominal) level of functional foods knowledge is related to soy consumption" (p. 148). To this end, they conducted a one-way ANOVA between the two groups (people with either no or some knowledge of functional foods), with the resulting F statistic being shown in the right-hand column of the table. You can see that with one exception ("Soy has an aftertaste"), all of the F statistics have at least one star by them, indicating that they are significant at the .05 or .01 level. Here is our first error, because as every undergraduate knows, F(1, D) is never significant at the .05 level below a value of 3.84 no matter how large the denominator degrees of freedom D are, thus making three of those stars (for 3.1, 3.6, and 2.9) wrong.
Also wrong are the reported degrees of freedom for the F test, which with the sample sizes at the top of the columns (138 and 269) should be (1, 405). Furthermore, the number of participants who answered the question about their knowledge of functional foods seems to be inconsistently reported: first as 363 on p. 147 of the article, then as 190 in the footnote to Table 1, which also appears to claim that 138 + 269 = 580. (It's also slightly surprising that out of 770 participants, either 363 or 190 didn't give a simple one-line answer to the question about their knowledge of functional foods; the word "none" would apparently have sufficed for them to be included.)
However, if you have been following this story for the past couple of months, you will know that these kinds of rather sloppy errors are completely normal in articles from this lab, and you might have guessed that I wouldn't be writing yet another post about such "minor" problems unless there was quite a lot more to come.
It would be nice to be able to check the F statistics in the above table, but that requires knowledge of the standard deviations (SDs) of the means in each case, which are not provided. However, we can work provisionally with the simplifying assumption that the SDs are equal for each mean response to the same item. (If the SDs are unequal, then one will be smaller than the pooled value and the other will be larger, which actually exacerbates the problems reported below.) Using this assumption, we can try a number of candidate pooled SDs in an iterative process and calculate an approximation to the SD for the two groups. That gives these results:

The items on lines 1–3 and 26–28 had open-ended response formats, but those on lines 4–25 were answered on 9-point Likert scales, from 1="strongly disagree" to 9="strongly agree". This means that the absolute maximum possible SD for the means on these lines is about 4.01 (where 4 is half the difference between the highest and lowest value, and .01 is a little bonus for the fact that the formula for the sample SD has N−1, rather than N, in the denominator). You would get that maximum SD if half of your participants responded with 1 and half responded with 9. And that is only possible with a mean of 5.0; as the mean approaches 1 or 9, the maximum SD becomes smaller, so that for example with a mean of 7.0 or 3.0 the maximum SD is around 3.5. (Again, it is possible that one of the SDs is smaller and the other larger. But if we can show that the pooled SD is impossible with either mean, then any split into two different SDs will result in one SD being even higher, making one of the means "even more impossible".)
In the above image, I have highlighted in orange (because red makes the numbers hard to read) those SDs that are impossible, either because they exceed 4.01, or because they exceed the largest possible SD for the corresponding means. In a couple of cases the SD is possible for one of the means (M1), but not the other (M2), and if the SD of M2 were reduced to allow it to be (just) possible, the SD of M1 would become impossible.
I have also highlighted in yellow the SDs that, while not strictly impossible, are highly implausible. For example, the most moderate of these cases ("Soy will fulfill my protein requirements", M=4.8, SD=3.4) requires well over half of the 138 participants in the "no knowledge of functional food" group to have responded with either 1 or 9 to an item that, on average, they had no very strong opinion about (as shown by the mean, which is almost exactly midway between "strongly disagree" and "strongly agree"). The possible distribution of these responses shown below reminds me about the old joke about the statistician with one foot in a bucket of ice and another in a bucket of boiling water, who reports being "very comfortable" on average.

Thus, around half of the results—either the means, or the F statistics, or both—for the 22 items in the middle of Table 2 of Chan cannot be correct, either due to mathematical impossibility or because it would require extreme response patterns that simply don't happen in this kind of survey (and which, if they had occurred by some strange chance, the authors ought to have detected and reported).
A demonstration that several of the results for the open-ended (first and last three) items of the table are also extremely implausible is beyond the scope of this blog post (hint: some people spend a lot of time at the store checking that there is no soy in the food they buy, and some people apparently eat dinner more than once a day), but my colleague James Heathers will probably be along to tell you all about this very soon as part of his exciting new tool/method/mousetrap that he calls SPRITE, which he kindly deployed to make the above image, and the three other similar images that appear later in this post.
One more point on the sample size of 770 in this study. The article reports that questionnaires were mailed to "a random national sample (obtained from U.S. Census data) of 1,002 adults", and 770 were returned, for a payment of $6. This number of responses seems to be very common in research from this lab. For example, in this study 770 questionnaires out of 1,600 were returned by a sample of "North Americans", a term which (cf. the description of the sample in Westgren, below) presumably means US and Canadian residents, who were paid $5. Meanwhile, in this study, 770 questionnaires out of 2,000 mailed to "a representative sample from 50 US states" were returned in exchange for $3. One might get the impression from those proportions that paying more brings a higher response rate, but in this study when 2,000 questionnaires were mailed to "North Americans", even a $6 payment was not sufficient to change the number of responses from 770. Finally, it is unclear whether the sample of 770 mentioned in this article and (in almost-identical paragraphs) in this article and this book chapter represents yet another mailing, or if it is the same as one of those just listed, because the references do not lead anywhere; this article gives slightly more details, but again refers back to one of the others. If any readers can find a published description of this "loyalty program survey of current customers of a Kraft product" then I would be interested to see it. (A couple of people have also mentioned to me that a response rate of 77%, or even half that, is remarkably high for a randomly mailed survey, even with an "honor check" as an incentive.)
Now let's look at the other two articles out of the three that are the main subject of this blog post. As we'll see, it makes sense to read them together.
Cheong (available here [PDF]) reports a study of the attitudes and soy consumption habits of a sample of 132 Indians and Pakistanis who were living in the United States (thus making the article's title, "Taste profiles that correlate with soy consumption in developing countries [emphasis added]", perhaps a little inaccurate) and associated in some way with UIUC. Westgren describes the results of a very similar study, with almost exactly the same items, among 606 randomly-selected North Americans (US and Canadian residents, selected from phone records).
The first thing one notices in reading these two articles is that about 40% of the text of Cheong has been duplicated verbatim in Westgren, making up about 20% of the latter article. We have seen this before with the lead author of these articles, but apparently he considers it not to be a big deal to "re-emphasize" his work in this way. Some of the duplicated text is in the Methods section, which a few people claim is not a particular egregious form of self-plagiarism, but the majority comes from the Results and Discussion sections, which is unusual, to say the least, for two different empirical articles. This image shows the extent of the duplication; Cheong is on the left, Westgren on the right.

The evolution of Cheong into Westgren can be followed by downloading two drafts of the latter article from here (dated May 2003) and here (dated July 2003). The July version is very close to the final published text of Westgren. Interestingly, the Properties field of both of these PDFs reveals that the working title of the manuscript was "Profiling the Soy Fanatic". The co-author on the May draft is listed as JaeHak Cheong, but by July this had been changed to Randall Westgren.
As with Chan, the really interesting element of each of these articles is their respective tables of results, which are presented below, with Cheong first and Westgren second. The first seven items were answered on a 1–9 Likert-type scale; the others are expressed as a number of evening meals per week and so one would normally expect people to reply with a number in the range 0–7.
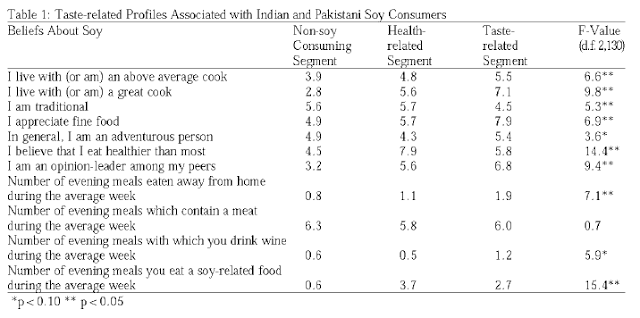
(For what it's worth, there is another incorrect significance star on the F statistic of 3.6 on the item "In general, I am an adventurous person" here.)
[[ Update 2017-03-23 22:10 UTC: As pointed out by an anonymous commenter, the above statement is incorrect. I hadn't taken into account that the numerator degrees of freedom are 2 here, or that the threshold for a star is p < 0.10, not 0.05. I apologise for this sloppiness on my part. However, this means that there are in fact two errors in the above table, because both this 3.6 and 5.9 ("Number of evening meals with which you drink wine during the average week") should have two stars. It's particularly strange than 5.9 doesn't have two stars, since 5.3 ("I am traditional") does. ]]

Just as an aside here: I'm not an expert on the detailed eating habits of Indians and Pakistanis, but as far as I know, soy is not a major component of the traditional diet of citizens of either nation. Pakistanis are mostly Muslims, almost all of whom eat meat, and Indians are mostly Hindus and Sikhs (who tend to consume a lot of dairy if they are vegetarians) or Muslims. So I was quite surprised that out of 132 people from those two countries surveyed in Cheong, 91 claimed to eat soy. Maybe people from the Indian sub-continent make more radical adaptations to their diet when they join an American academic community than just grabbing the occasional lunch at Subway.
OK, back to the tables. Once again, it's instructive to examine the F statistics here, as they tell us something about the possible SDs for the samples.
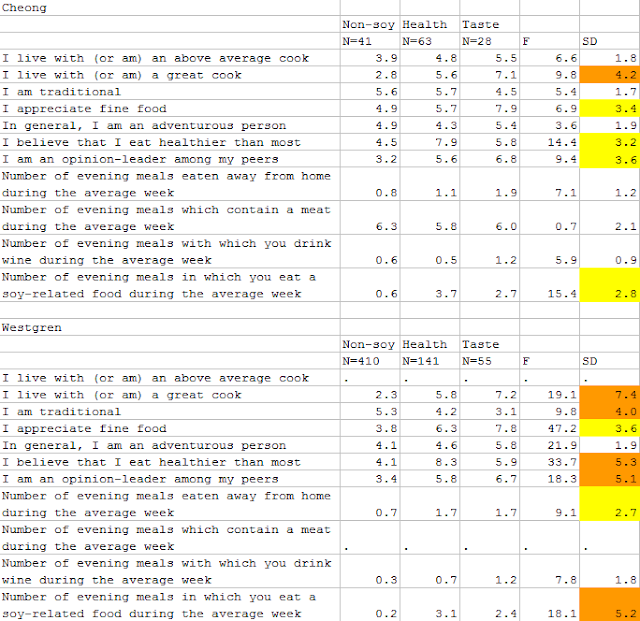
For ease (I hope) of comparison, I have included blank lines for the two items that appeared in Cheong but not in Westgren. It is not clear why these two items were not included, since the May 2003 draft version of Westgren contains results (means and F statistics) for these items that are not the same as those in the published Cheong article, and so presumably represent the results of the second survey (rather than the remnants of the recycling exercise that was apparently involved in the generation of the Westgren manuscript). There are also four means that differ between the May draft of Westgren and the final article: "I live with (or am) a great cook"/"Health-related" (6.1 instead of 5.8), and all three means for "Number of evening meals eaten away from home during the average week" (0.9, 1.2, and 2.0 instead of 0.7, 1.7, and 1.7). However, the F statistics in the draft version for these two items are the same as in the published article.
The colour scheme in the tables above is the same as in the corresponding table for Chan, shown earlier. Again, a lot of the SDs are just impossible, and several others are, to say the least, highly implausible. As an example of the latter, consider the number of evening meals containing a soy-related food per week in the Indian-Pakistani group. If the SD for the first mean of 0.6 is indeed equal to the pooled value of 2.8, then the only possible distribution of integers giving that mean and SD suggests that two of these "non soy-eaters" must be eating soy for dinner eleven and fourteen times per week, respectively:

If instead the SD for this mean is half of that pooled value at 1.4, then a couple of the non-soy eaters must be having soy for dinner four or five times a week. This is one of several possible distributions, but they all look fairly similar:

This "more reasonable" SD of 1.4 for the non-soy eaters would also imply a pooled SD of 3.2 for the other two means, which would mean that about a third of the people who were "unambiguously categorized as eating soy primarily for health reasons" actually reported never eating soy for dinner at all:

To summarise: For five out of 11 items in Cheong, and seven out of nine items in Westgren, the numbers in the tables cannot—either due to mathematical limitations, or simply because of our prior knowledge about how the world works—be correct representations of the responses given by the participants, because the means and F statistics imply standard deviations that either cannot exist, or require crazy distributions.
It is also interesting to note also that the items in Cheong that had problems with impossible or highly implausible SDs in their study of 132 Indians and Pakistanis also had similar problems in Westgren with a sample of 606 random North Americans. This might suggest that whatever is causing these problems might not be an entirely random factor.
Two items from Cheong were not repeated in Westgren (in fact, as noted previously, it seems from the May 2003 draft of Westgren that these two items were apparently included in the questionnaire, but the responses were dropped at some point during drafting), but most of the answers to the remaining nine items seem to be quite similar. As an exercise, I took the sets of 27 means corresponding to the items that appear in both tables and treated them as vectors of potentially independent results. The scatterplot of these two vectors looks like this:

This seems to me like a remarkably straight line. As noted above, some of the variables have a range of 1–9 and others 0–7, but I don't think that changes very much.
I also calculated the correlation coefficient for these 27 pairs of scores. I'm not going to give a p value for this because, whatever the sample, there is likely to be some non-zero degree of correlation at a few points in these data anyway due to the nature of certain items (e.g., for "Number of evening meals in which you eat a soy-related food during the average week", we would expect the people who "never eat soy" to have lower values than those who stated that consumed soy for either taste or health reasons, whatever the sample), so it's not quite clear what our null hypothesis ought to be.
> cheong = c(2.8,5.6,7.1,5.6,5.7,4.5,4.9,5.7,7.9,4.9,4.3,5.4,
4.5,7.9,5.8,3.2,5.6,6.8,0.8,1.1,1.9,0.6,0.5,1.2,0.6,3.7,2.7)
> westgren = c(2.3,5.8,7.2,5.3,4.2,3.1,3.8,6.3,7.8,4.1,4.6,5.8,
4.1,8.3,5.9,3.4,5.8,6.7,0.7,1.7,1.7,0.3,0.7,1.2,0.2,3.1,2.4)
> cor(cheong, westgren)
[1] 0.9731398
Even allowing for the likely non-zero within-item correlation across the two samples mentioned in the preceding paragraph, this seems like a very high value. We already know from earlier analyses that a considerable number of either the means or the F statistics (or both) in these two articles are not correct. If the problem is in the means, then something surprising has happened for these incorrect means to correlate so highly across the two studies. If, however, these means are correct, then as with the brand loyalty articles discussed here (section E), the authors seem to have discovered a remarkably stable effect in two very different populations.
A further lack of randomness can be observed in the last digits of the means and F statistics in the three published tables of results (in the Cheong, Chan, and Westgren articles). Specifically, there is a curious absence of zeroes among these last digits. Intuitively, we would expect 10% of the means of measured random variables, and the F statistics that result from comparing those means, to end in a zero at the last decimal place (which in most cases in the articles we are examining here is the only decimal place) . A mathematical demonstration that this is indeed a reasonable expectation can be found here.
Here is a plot of the number of times each decimal digit appears in the last position in these tables:

For each table of results, here are the number of zeroes:
Chan: 84 numbers, 3 ending in zero (item 21/F statistic, 22/"Some knowledge", and 28/F statistic).
Cheong: 44 numbers, 1 ending in zero ("Number of evening meals which contain a meat during
the average week"/"Taste").
Westgren: 36 numbers, none ending in zero.
Combining these three counts, we have four zeroes out of a total of 164 numbers. We can compute (using R, or Excel's BINOMDIST function, or the online calculator here) the binomial probability of this number of zeroes (or fewer) occurring by chance, if the last digits of the numbers in question are indeed random (either because they are the last digits of correctly calculated item means or F statistics, or because the errors—which we know, from the above analysis of the SDs, that some of them must represent—are also random).
> pbinom(4, size=164, prob=0.1)
[1] 0.0001754387
Alternatively, as suggested by Mosimann, Dahlberg, Davidian, and Krueger (2002), we can calculate the chi-square statistics for the counts of each of the 10 different final digits in these tables, to see how [im]probable the overall distribution of all of the final digits is:
> chisq.test(c(4,15,14,17,15,11,19,20,26,23))
X-squared = 21.244, df = 9, p-value = 0.01161
Either way, to put this in terms of a statistical hypothesis test in the Fisherian tradition, we would seem to have good reasons to reject the null hypothesis that the last digits of these numbers resulted from random processes.
Ignoring the "minor" problems that we left behind a couple of thousand words ago, such as the
unwarranted significance stars, the inconsistently-reported sample sizes, and the apparent recycling of substantial amounts of text from one article to another, we have the following:
1. Around half of the F statistics reported in these three articles cannot be correct, given the means that were reported. Either the means are wrong, or the F statistics are wrong, or both.
2. The attitudes towards soy products reported by the participants in the Cheong and Westgren studies are remarkably similar, despite the samples having been drawn from very different populations. This similarity also seems to apply to the items for which the results give impossible test statistics.
3. The distribution of the digits after the decimal point in the numbers representing the means and F statistics does not appear to be consistent with these numbers representing the values of measured random variables (or statistical operations performed on such variables); nor does it appear to be consistent with random transcription errors.
I am trying hard to think of possible explanations for all of this.
All of the relevant files from this article are available here, if the links given earlier don't work
and/or your institution doesn't have a subscription to the relevant journal
In this post I'm going to explore some mysterious patterns in the data of three more articles that were published when Dr. Wansink was still at the University of Illinois at Urbana-Champaign (UIUC). These articles appear to form a family because they all discuss consumer attitudes towards soy products; Dr. Wansink's CV here [PDF] records that in 2001 he received $3,000 for “Disseminating soy-based research to developing countries”. The articles are:
Wansink, B., & Chan, N. (2001). Relation of soy consumption to nutritional knowledge. Journal of Medicinal Food, 4, 145–150. http://dx.doi.org/10.1089/109662001753165729
Wansink, B., & Cheong, J. (2002). Taste profiles that correlate with soy consumption in
developing countries. Pakistan Journal of Nutrition, 1, 276–278.
Wansink, B., & Westgren, R. (2003). Profiling taste-motivated segments. Appetite, 41, 323–327.
http://dx.doi.org/10.1016/S0195-6663(03)00120-X
For brevity, I'll mostly refer to these articles by the names of their co-authors, as "Chan", "Cheong", and "Westgren", respectively.
Wansink & Chan (2001)
Chan describes a study of people's attitudes towards "medicinal and functional foods such as soy". It's not clear what a "functional food"—or, indeed, a "non-functional food"—might be, and it might come as a surprise to people in many Asian countries who have been consuming soy all their life to hear it described as a "medicinal food", but I guess this article was written from an American perspective. Exactly what is categorised under "soy" is not made clear in the article, but one of the items asked people how many times in the past year they purchased "tofu or soy milk", so I presume we're talking about those kind of soy products that tend to be associated in Western countries with vegetarian or vegan diets, rather than soy sauce or processed foods containing soy lecithin.
Of interest to us here is Table 2 from Chan. This shows the responses of 770 randomly-selected Americans, split by their knowledge of "functional foods" (apparently this knowledge was determined by asking them to define that term, with the response being coded in some unspecified way) to a number of items about their attitudes and purchasing habits with respect to soy products. Here is that table:

The authors' stated aim in this study was to see whether "a basic (even nominal) level of functional foods knowledge is related to soy consumption" (p. 148). To this end, they conducted a one-way ANOVA between the two groups (people with either no or some knowledge of functional foods), with the resulting F statistic being shown in the right-hand column of the table. You can see that with one exception ("Soy has an aftertaste"), all of the F statistics have at least one star by them, indicating that they are significant at the .05 or .01 level. Here is our first error, because as every undergraduate knows, F(1, D) is never significant at the .05 level below a value of 3.84 no matter how large the denominator degrees of freedom D are, thus making three of those stars (for 3.1, 3.6, and 2.9) wrong.
Also wrong are the reported degrees of freedom for the F test, which with the sample sizes at the top of the columns (138 and 269) should be (1, 405). Furthermore, the number of participants who answered the question about their knowledge of functional foods seems to be inconsistently reported: first as 363 on p. 147 of the article, then as 190 in the footnote to Table 1, which also appears to claim that 138 + 269 = 580. (It's also slightly surprising that out of 770 participants, either 363 or 190 didn't give a simple one-line answer to the question about their knowledge of functional foods; the word "none" would apparently have sufficed for them to be included.)
However, if you have been following this story for the past couple of months, you will know that these kinds of rather sloppy errors are completely normal in articles from this lab, and you might have guessed that I wouldn't be writing yet another post about such "minor" problems unless there was quite a lot more to come.
It would be nice to be able to check the F statistics in the above table, but that requires knowledge of the standard deviations (SDs) of the means in each case, which are not provided. However, we can work provisionally with the simplifying assumption that the SDs are equal for each mean response to the same item. (If the SDs are unequal, then one will be smaller than the pooled value and the other will be larger, which actually exacerbates the problems reported below.) Using this assumption, we can try a number of candidate pooled SDs in an iterative process and calculate an approximation to the SD for the two groups. That gives these results:

The items on lines 1–3 and 26–28 had open-ended response formats, but those on lines 4–25 were answered on 9-point Likert scales, from 1="strongly disagree" to 9="strongly agree". This means that the absolute maximum possible SD for the means on these lines is about 4.01 (where 4 is half the difference between the highest and lowest value, and .01 is a little bonus for the fact that the formula for the sample SD has N−1, rather than N, in the denominator). You would get that maximum SD if half of your participants responded with 1 and half responded with 9. And that is only possible with a mean of 5.0; as the mean approaches 1 or 9, the maximum SD becomes smaller, so that for example with a mean of 7.0 or 3.0 the maximum SD is around 3.5. (Again, it is possible that one of the SDs is smaller and the other larger. But if we can show that the pooled SD is impossible with either mean, then any split into two different SDs will result in one SD being even higher, making one of the means "even more impossible".)
In the above image, I have highlighted in orange (because red makes the numbers hard to read) those SDs that are impossible, either because they exceed 4.01, or because they exceed the largest possible SD for the corresponding means. In a couple of cases the SD is possible for one of the means (M1), but not the other (M2), and if the SD of M2 were reduced to allow it to be (just) possible, the SD of M1 would become impossible.
I have also highlighted in yellow the SDs that, while not strictly impossible, are highly implausible. For example, the most moderate of these cases ("Soy will fulfill my protein requirements", M=4.8, SD=3.4) requires well over half of the 138 participants in the "no knowledge of functional food" group to have responded with either 1 or 9 to an item that, on average, they had no very strong opinion about (as shown by the mean, which is almost exactly midway between "strongly disagree" and "strongly agree"). The possible distribution of these responses shown below reminds me about the old joke about the statistician with one foot in a bucket of ice and another in a bucket of boiling water, who reports being "very comfortable" on average.

Thus, around half of the results—either the means, or the F statistics, or both—for the 22 items in the middle of Table 2 of Chan cannot be correct, either due to mathematical impossibility or because it would require extreme response patterns that simply don't happen in this kind of survey (and which, if they had occurred by some strange chance, the authors ought to have detected and reported).
A demonstration that several of the results for the open-ended (first and last three) items of the table are also extremely implausible is beyond the scope of this blog post (hint: some people spend a lot of time at the store checking that there is no soy in the food they buy, and some people apparently eat dinner more than once a day), but my colleague James Heathers will probably be along to tell you all about this very soon as part of his exciting new tool/method/mousetrap that he calls SPRITE, which he kindly deployed to make the above image, and the three other similar images that appear later in this post.
One more point on the sample size of 770 in this study. The article reports that questionnaires were mailed to "a random national sample (obtained from U.S. Census data) of 1,002 adults", and 770 were returned, for a payment of $6. This number of responses seems to be very common in research from this lab. For example, in this study 770 questionnaires out of 1,600 were returned by a sample of "North Americans", a term which (cf. the description of the sample in Westgren, below) presumably means US and Canadian residents, who were paid $5. Meanwhile, in this study, 770 questionnaires out of 2,000 mailed to "a representative sample from 50 US states" were returned in exchange for $3. One might get the impression from those proportions that paying more brings a higher response rate, but in this study when 2,000 questionnaires were mailed to "North Americans", even a $6 payment was not sufficient to change the number of responses from 770. Finally, it is unclear whether the sample of 770 mentioned in this article and (in almost-identical paragraphs) in this article and this book chapter represents yet another mailing, or if it is the same as one of those just listed, because the references do not lead anywhere; this article gives slightly more details, but again refers back to one of the others. If any readers can find a published description of this "loyalty program survey of current customers of a Kraft product" then I would be interested to see it. (A couple of people have also mentioned to me that a response rate of 77%, or even half that, is remarkably high for a randomly mailed survey, even with an "honor check" as an incentive.)
Now let's look at the other two articles out of the three that are the main subject of this blog post. As we'll see, it makes sense to read them together.
Wansink & Cheong (2002); Wansink & Westgren (2003)
Cheong (available here [PDF]) reports a study of the attitudes and soy consumption habits of a sample of 132 Indians and Pakistanis who were living in the United States (thus making the article's title, "Taste profiles that correlate with soy consumption in developing countries [emphasis added]", perhaps a little inaccurate) and associated in some way with UIUC. Westgren describes the results of a very similar study, with almost exactly the same items, among 606 randomly-selected North Americans (US and Canadian residents, selected from phone records).
The first thing one notices in reading these two articles is that about 40% of the text of Cheong has been duplicated verbatim in Westgren, making up about 20% of the latter article. We have seen this before with the lead author of these articles, but apparently he considers it not to be a big deal to "re-emphasize" his work in this way. Some of the duplicated text is in the Methods section, which a few people claim is not a particular egregious form of self-plagiarism, but the majority comes from the Results and Discussion sections, which is unusual, to say the least, for two different empirical articles. This image shows the extent of the duplication; Cheong is on the left, Westgren on the right.

The evolution of Cheong into Westgren can be followed by downloading two drafts of the latter article from here (dated May 2003) and here (dated July 2003). The July version is very close to the final published text of Westgren. Interestingly, the Properties field of both of these PDFs reveals that the working title of the manuscript was "Profiling the Soy Fanatic". The co-author on the May draft is listed as JaeHak Cheong, but by July this had been changed to Randall Westgren.
As with Chan, the really interesting element of each of these articles is their respective tables of results, which are presented below, with Cheong first and Westgren second. The first seven items were answered on a 1–9 Likert-type scale; the others are expressed as a number of evening meals per week and so one would normally expect people to reply with a number in the range 0–7.

[[ Update 2017-03-23 22:10 UTC: As pointed out by an anonymous commenter, the above statement is incorrect. I hadn't taken into account that the numerator degrees of freedom are 2 here, or that the threshold for a star is p < 0.10, not 0.05. I apologise for this sloppiness on my part. However, this means that there are in fact two errors in the above table, because both this 3.6 and 5.9 ("Number of evening meals with which you drink wine during the average week") should have two stars. It's particularly strange than 5.9 doesn't have two stars, since 5.3 ("I am traditional") does. ]]

Just as an aside here: I'm not an expert on the detailed eating habits of Indians and Pakistanis, but as far as I know, soy is not a major component of the traditional diet of citizens of either nation. Pakistanis are mostly Muslims, almost all of whom eat meat, and Indians are mostly Hindus and Sikhs (who tend to consume a lot of dairy if they are vegetarians) or Muslims. So I was quite surprised that out of 132 people from those two countries surveyed in Cheong, 91 claimed to eat soy. Maybe people from the Indian sub-continent make more radical adaptations to their diet when they join an American academic community than just grabbing the occasional lunch at Subway.
OK, back to the tables. Once again, it's instructive to examine the F statistics here, as they tell us something about the possible SDs for the samples.

For ease (I hope) of comparison, I have included blank lines for the two items that appeared in Cheong but not in Westgren. It is not clear why these two items were not included, since the May 2003 draft version of Westgren contains results (means and F statistics) for these items that are not the same as those in the published Cheong article, and so presumably represent the results of the second survey (rather than the remnants of the recycling exercise that was apparently involved in the generation of the Westgren manuscript). There are also four means that differ between the May draft of Westgren and the final article: "I live with (or am) a great cook"/"Health-related" (6.1 instead of 5.8), and all three means for "Number of evening meals eaten away from home during the average week" (0.9, 1.2, and 2.0 instead of 0.7, 1.7, and 1.7). However, the F statistics in the draft version for these two items are the same as in the published article.
The colour scheme in the tables above is the same as in the corresponding table for Chan, shown earlier. Again, a lot of the SDs are just impossible, and several others are, to say the least, highly implausible. As an example of the latter, consider the number of evening meals containing a soy-related food per week in the Indian-Pakistani group. If the SD for the first mean of 0.6 is indeed equal to the pooled value of 2.8, then the only possible distribution of integers giving that mean and SD suggests that two of these "non soy-eaters" must be eating soy for dinner eleven and fourteen times per week, respectively:

If instead the SD for this mean is half of that pooled value at 1.4, then a couple of the non-soy eaters must be having soy for dinner four or five times a week. This is one of several possible distributions, but they all look fairly similar:

This "more reasonable" SD of 1.4 for the non-soy eaters would also imply a pooled SD of 3.2 for the other two means, which would mean that about a third of the people who were "unambiguously categorized as eating soy primarily for health reasons" actually reported never eating soy for dinner at all:

To summarise: For five out of 11 items in Cheong, and seven out of nine items in Westgren, the numbers in the tables cannot—either due to mathematical limitations, or simply because of our prior knowledge about how the world works—be correct representations of the responses given by the participants, because the means and F statistics imply standard deviations that either cannot exist, or require crazy distributions.
Similarities between results in Cheong and Westgren
It is also interesting to note also that the items in Cheong that had problems with impossible or highly implausible SDs in their study of 132 Indians and Pakistanis also had similar problems in Westgren with a sample of 606 random North Americans. This might suggest that whatever is causing these problems might not be an entirely random factor.
Two items from Cheong were not repeated in Westgren (in fact, as noted previously, it seems from the May 2003 draft of Westgren that these two items were apparently included in the questionnaire, but the responses were dropped at some point during drafting), but most of the answers to the remaining nine items seem to be quite similar. As an exercise, I took the sets of 27 means corresponding to the items that appear in both tables and treated them as vectors of potentially independent results. The scatterplot of these two vectors looks like this:

This seems to me like a remarkably straight line. As noted above, some of the variables have a range of 1–9 and others 0–7, but I don't think that changes very much.
I also calculated the correlation coefficient for these 27 pairs of scores. I'm not going to give a p value for this because, whatever the sample, there is likely to be some non-zero degree of correlation at a few points in these data anyway due to the nature of certain items (e.g., for "Number of evening meals in which you eat a soy-related food during the average week", we would expect the people who "never eat soy" to have lower values than those who stated that consumed soy for either taste or health reasons, whatever the sample), so it's not quite clear what our null hypothesis ought to be.
> cheong = c(2.8,5.6,7.1,5.6,5.7,4.5,4.9,5.7,7.9,4.9,4.3,5.4,
4.5,7.9,5.8,3.2,5.6,6.8,0.8,1.1,1.9,0.6,0.5,1.2,0.6,3.7,2.7)
> westgren = c(2.3,5.8,7.2,5.3,4.2,3.1,3.8,6.3,7.8,4.1,4.6,5.8,
4.1,8.3,5.9,3.4,5.8,6.7,0.7,1.7,1.7,0.3,0.7,1.2,0.2,3.1,2.4)
> cor(cheong, westgren)
[1] 0.9731398
Even allowing for the likely non-zero within-item correlation across the two samples mentioned in the preceding paragraph, this seems like a very high value. We already know from earlier analyses that a considerable number of either the means or the F statistics (or both) in these two articles are not correct. If the problem is in the means, then something surprising has happened for these incorrect means to correlate so highly across the two studies. If, however, these means are correct, then as with the brand loyalty articles discussed here (section E), the authors seem to have discovered a remarkably stable effect in two very different populations.
Uneven distribution of last digits
A further lack of randomness can be observed in the last digits of the means and F statistics in the three published tables of results (in the Cheong, Chan, and Westgren articles). Specifically, there is a curious absence of zeroes among these last digits. Intuitively, we would expect 10% of the means of measured random variables, and the F statistics that result from comparing those means, to end in a zero at the last decimal place (which in most cases in the articles we are examining here is the only decimal place) . A mathematical demonstration that this is indeed a reasonable expectation can be found here.
Here is a plot of the number of times each decimal digit appears in the last position in these tables:

For each table of results, here are the number of zeroes:
Chan: 84 numbers, 3 ending in zero (item 21/F statistic, 22/"Some knowledge", and 28/F statistic).
Cheong: 44 numbers, 1 ending in zero ("Number of evening meals which contain a meat during
the average week"/"Taste").
Westgren: 36 numbers, none ending in zero.
Combining these three counts, we have four zeroes out of a total of 164 numbers. We can compute (using R, or Excel's BINOMDIST function, or the online calculator here) the binomial probability of this number of zeroes (or fewer) occurring by chance, if the last digits of the numbers in question are indeed random (either because they are the last digits of correctly calculated item means or F statistics, or because the errors—which we know, from the above analysis of the SDs, that some of them must represent—are also random).
> pbinom(4, size=164, prob=0.1)
[1] 0.0001754387
Alternatively, as suggested by Mosimann, Dahlberg, Davidian, and Krueger (2002), we can calculate the chi-square statistics for the counts of each of the 10 different final digits in these tables, to see how [im]probable the overall distribution of all of the final digits is:
> chisq.test(c(4,15,14,17,15,11,19,20,26,23))
X-squared = 21.244, df = 9, p-value = 0.01161
Either way, to put this in terms of a statistical hypothesis test in the Fisherian tradition, we would seem to have good reasons to reject the null hypothesis that the last digits of these numbers resulted from random processes.
Summary
Ignoring the "minor" problems that we left behind a couple of thousand words ago, such as the
unwarranted significance stars, the inconsistently-reported sample sizes, and the apparent recycling of substantial amounts of text from one article to another, we have the following:
1. Around half of the F statistics reported in these three articles cannot be correct, given the means that were reported. Either the means are wrong, or the F statistics are wrong, or both.
2. The attitudes towards soy products reported by the participants in the Cheong and Westgren studies are remarkably similar, despite the samples having been drawn from very different populations. This similarity also seems to apply to the items for which the results give impossible test statistics.
3. The distribution of the digits after the decimal point in the numbers representing the means and F statistics does not appear to be consistent with these numbers representing the values of measured random variables (or statistical operations performed on such variables); nor does it appear to be consistent with random transcription errors.
I am trying hard to think of possible explanations for all of this.
All of the relevant files from this article are available here, if the links given earlier don't work
and/or your institution doesn't have a subscription to the relevant journal
Are you sure the binomial test on the zeros makes sense? digits are not uniformly distributed, see benford's law!
ReplyDelete@Anonymous: Benford's Law applies to the *first* digit of numbers that correspond to real-world quantities. At issue here is the *last* digit of the means of random variables and/or the test statistics associated therewith, which ought (cf. the reference I gave in the post) to be uniformly distributed.
ReplyDeleteAdditionally, although it's not especially relevant here, Benford's Law would not be expected to apply here, because most of the quantities in question are Likert-type data that are constrained to [1..9]. In fact, assuming some sort of normaal distribution, one might expect a prevalence of numbers around the midpoint (5) for the first digits. But I did not examine the first digits, because they are not relevant to my argument about the lack of randomness in these data.
PS: It's not completely clear to me whether the chi-square or the binomial test is the right one, so I showed both. I was quite surprised at the difference in p values between them. In another article from the same laboratory, also with a sample of 770 people (!), the same lack of randomness appears; in that case, however, the p values for the chi square and binomial test are similar (.008 and .007, respectively). Of course, it depends on just how strangely small the number of zeroes is.
ReplyDeleteAren't you performing implicit multiple comparisons (with the binomial test) by choosing the digit that has the lowest frequency?
ReplyDelete@Boris: Actually I did hypothesise a priori that zero would be the least represented digit --- that is, when deciding to copy/paste these numbers from the PDF into R to check them, I only counted the trailing zeroes --- based on page 43 of the Mosimann et al. article that is referenced in the post (and other stuff I had previously read on this topic). But I can't prove that, so feel free to apply a correction such as Bonferroni to the .00017, or just look at the chi-square p value.
ReplyDeleteapparently, the study was rerun with a completely different set of participants, and yet almost all of the measured results—17 out of 18—were identical, including the decimal places.
ReplyDeleteThe level of replicability implies that Wansink is obtaining two or three significant digits of accuracy, from surveys of only a few hundred people, which is an accomplshment worthy of a Nobel Prize as soon as he documents the details.
"(For what it's worth, there is another incorrect significance star on the F statistic of 3.6 on the item 'In general, I am an adventurous person' here.)"
ReplyDeletepf(3.6, 2, 130, lower.tail = FALSE) = 0.03008158
Do you refer to the fact that it is crowned with just one star (signifying p less than 0.10) where in fact it could've earned twice the pride (less than 0.05)? Or is there some degrees of freedom confusion or something else that I'm missing?
"because as every undergraduate knows, F(1,D) is never significant at the .05 level below a value of 3.84 [actually, 3.8415] no matter how large the denominator degrees of freedom D are"
ReplyDeleteI have taught statistics for many years. No, every undergraduate does not know this. It is not often explicitly stated in textbooks. It is evident from F tables of course but now with the availability of statistical packages many if not most textbooks omit F tables. Most professors (even those who regularly use analysis of variance) don't know this either. You probably didn't know it yourself until you looked it up in a table. A little less self-righteous hypocrisy would be good.
Finally, it is unclear whether the sample of 770 mentioned in this article and (in almost-identical paragraphs) in this article and this book chapter represents yet another mailing
ReplyDeleteThe degree of text recycling in those examples is impressive. It is as if Wansink is republishing the same chapter again and again, with different "courtesy authors" each time, who contribute nothing substantial but appreciate the log-rolling.
@Anonymous: Oops, I was forgetting that there are three columns and the DFs are (2,130) rather then (1,130) here. I added a note above. Thanks for spotting this.
ReplyDelete^ My question also.
ReplyDelete"(hint: some people spend a lot of time at the store checking that there is no soy in the food they buy, and some people apparently eat dinner more than once a day)"
ReplyDeleteI'm a year and a half late to this conversation, but in complete fairness, the former is true. Soy is one of the most common food allergies, and someone who's especially sensitive to it may have to scrutinize all their processed food purchases to avoid it.