Some concerns have been expressed recently (e.g., here) about a few of the
research articles coming from the Cornell Food and Brand Lab. While
reading some past work from the same lab, I noticed some phrases that seemed to
recur. On doing some further comparisons, I found several examples of
apparent duplicate publication. I list five such examples here.
Here are a couple of paragraphs from the same author that have been published at least five times over a 15-year period, with just a few very minor changes of wording each time. I have copied and pasted the relevant text here so that you can see all of the different versions. (I hope the various publishers will allow this as "fair use".)
1. Wansink, B., & Ray, M. L. (1997). Developing copy tests that estimate brand usage. In W. Wells (Ed.), Measuring advertising effectiveness (pp. 359–370). Cambridge, MA: Lexington Books.
From page 361:
From page 309:
Sensory tests that predict consumer acceptance. Food Quality and Preference, 14, 23–26. http://dx.doi.org/10.1016/S0950-3293(02)00035-6
From page 25:
From pages 134–135:
From page 336:
Wansink, B. (2015). Change their choice! Changing behavior using the CAN approach and activism research. Psychology & Marketing, 32, 486–500. http://dx.doi.org/10.1002/mar.20794
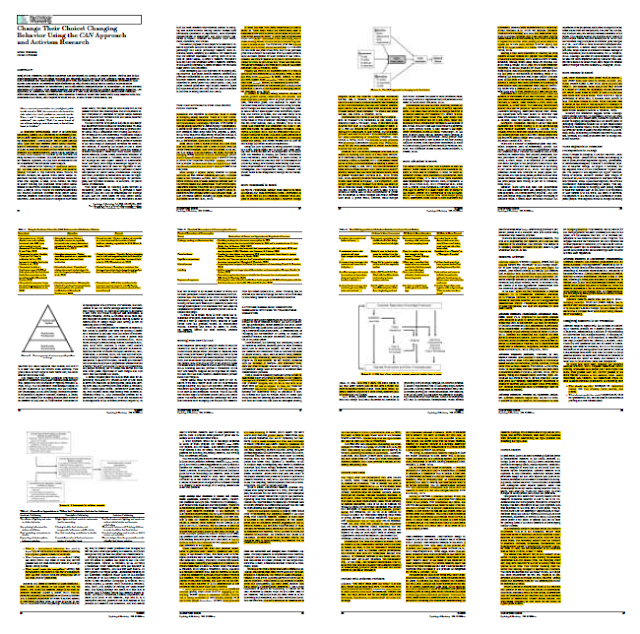
The image below shows the extent to which the 2015 article appears to consist of duplicated text from other publications. Everything in yellow, plus three of the four figures (which I couldn't work out how to highlight in the PDF) has been published before, some of it twice; I estimate that this represents about 50% of the article.
Specifically, parts of this article appeared to have been copied without attribution from the following works (listed in approximate descending order of quantity of apparently duplicated text):
Wansink, B. (2011). Activism research: Designing transformative lab and field studies. In D. G. Mick, S. Pettigrew, C. Pechmann, & J. L. Ozanne (Eds.), Transformative consumer research for personal and collective well-being (pp. 66–88). New York, NY: Routledge.
Wansink, B. (2013). Convenient, attractive, and normative: The CAN approach to making children slim by design. Childhood Obesity, 9, 277-278. http://dx.doi.org/10.1089/chi.2013.9405
Wansink, B. (2015). Slim by design: Moving from Can’t to CAN. In C. Roberto (Ed.), Behavioral economics and public health (pp. 237–264). New York, NY: Oxford University Press.
Wansink, B. (2010). From mindless eating to mindlessly eating better. Physiology & Behavior, 100, 454–463. http://dx.doi.org/10.1016/j.physbeh.2010.05.003
Wansink, B., Just, D. R., Payne, C. R., & Klinger, M. Z. (2012). Attractive names sustain increased vegetable intake in schools. Preventive Medicine, 55, 330–332. http://dx.doi.org/10.1016/j.ypmed.2012.07.012
Annotated versions of all of these documents are can be found here. A Google Books preview of the 2015 chapter "Slim by Design" is available here to compare with the annotated document, which is a final draft version.
The article:
Wansink, B., van Ittersum, K., & Werle, C. (2009). How negative experiences shape long-term food preferences: Fifty years from the World War II combat front. Appetite, 52, 750–752. http://dx.doi.org/10.1016/j.appet.2009.01.001
The book chapter:
Wansink, B., van Ittersum, K., & Werle, C. (2011). The lingering impact of negative food experiences: Which World War II veterans won’t eat Chinese food? In V. R. Preedy, R. R. Watson, & C. R. Martin (Eds.), Handbook of behavior, food and nutrition (Vol. 1, pp. 1705-1714). New York, NY: Springer.
It appears that almost all of the 2009 research article—about 1,400 words—has been duplicated in the 2011 chapter, with only very minor changes and the omission of five sentences, which account for less than 100 words. No disclosure of this re-use appears in the book chapter. (In contrast, Chapter 87 in the same book contains, on pages 1357 and 1360, explicit acknowledgements that two passages in that chapter contain material adapted from two other previously published sources; each of these passages corresponds to about 120 words in the original documents.)
You can examine annotated versions of the article and chapter here (note that the PDF file of the book chapter is an extract from a copy of the entire book that I found on Google). The book chapter is also available on Google Books here (although three of the ten pages are missing from the preview).
Here is a snapshot of the 2009 article (left) and the 2011 book chapter (right).

There seems to be a very close resemblance between the following two book chapters:
Wansink, B. (2011). Mindless eating: Environmental contributors to obesity. In J. Cawley (Ed.), The Oxford handbook of the social science of obesity (pp. 385–414). New York, NY: Oxford University Press.
Wansink, B. (2012). Hidden persuaders: Environmental contributors to obesity. In S. R. Akabas, S. A. Lederman, & B. J. Moore (Eds.), Textbook of obesity: Biological, psychological and cultural influences (pp. 108–122). Chichester, England: Wiley-Blackwell.
Each chapter is around 7,000 words long. The paragraph structures are identical. Most of the sentences are identical, or differ only in trivial details; a typical example is:
(Mindless Eating, p. 388)
It seems to be rather unusual to submit the same chapter for publication almost simultaneously to two different books in this way (the books were published less than six months apart, according to their respective pages on Amazon.com). One occasionally sees a book chapter that is based on an updated version of a previous journal article, but in that case one would expect to find a note making clear that some part of the work had been published before. I was unable to find any such disclosure in either of these books, whether on the first or last page of the chapters themselves, or in the front matter. I also contacted the editors of both books, none of whom recalled receiving any indication from the author that any of the text in the chapter was not original and unique to their book.
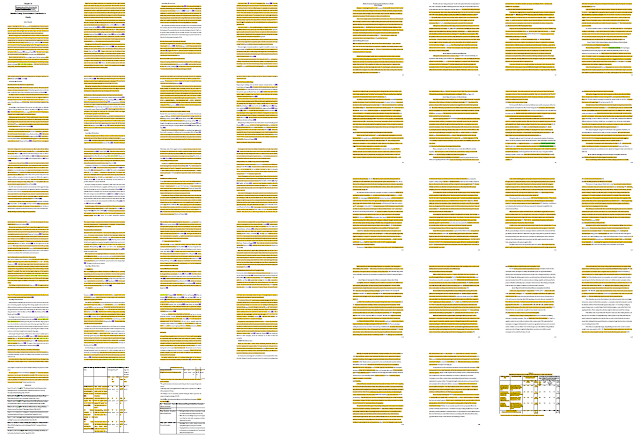
I found final draft versions of each of these chapters here and here. Each draft clearly states that it is intended for publication in the respective book in which it finally appeared, which would seem to rule out the possibility that this duplication arose by accident. Interested readers can compare my annotated versions of these final drafts with each other here. You can also check these drafts against the published chapters in the Google Books previews here and here (the first has the complete "Mindless Eating" chapter, but four pages of the "Hidden Persuaders" chapter are missing from the second). The degree of similarity is visible in this image, where yellow highlighting indicates text that it identical, word-for-word, between the two drafts ("Mindless Eating" is on the left, "Hidden Persuaders" is on the right).
In 2003, when the current director of the Cornell Food and Brand Lab was still at the University of Illinois at Urbana-Champaign [PDF], he published a report of a pair of studies that had a certain number of theoretical aspects in common with another pair of studies that he had previously described in a co-authored article from 2001. Here are the two references:
Wansink, B., & Seed, S. (2001). Making brand loyalty programs succeed. Brand Management, 8, 211–222. http://dx.doi.org/10.1057/palgrave.bm.2540021
Wansink, B. (2003). Developing a cost-effective brand loyalty program. Journal of Advertising Research, 43, 301–309. http://dx.doi.org/10.1017/S0021849903030290
I estimate that the introduction and summary sections from the two resulting articles are about 50% identical. You can judge for yourself from this image, in which the 2001 article is on the left, and the 2003 article is on the right. The introduction is on the first six pages of the 2001 article and the first four pages of the 2003 article. The summary section is near the end in each case.

Perhaps of greater interest here, though, is a comparison between Table 5 of the 2001 article and Table 2 of the 2003 article, which appear to be almost identical, despite purportedly reporting the results of two completely different studies.
Table 5 in the Wansink and Seed (2001) article apparently represents the results of the second study in that article, in which a questionnaire was administered to "153 members of the Brand Revitalisation Consumer Panel" (p. 216):

Table 2 in the Wansink (2003) article appears to summarise the results of Study 2 of that (i.e., 2003) article, which involved "a nationwide survey of 2,500 adult consumers who had been randomly recruited based on addresses obtained from census records. . . . Of the 2,500 questionnaires, 643 were returned in time to be included in the study".

(For what it is worth, the average gain for the low reward program across all three segments in the 2003 article appears to be ($0.00 + $2.00 + $2.00 = $4.00) / 3 = $1.33, rather than the $1.67 reported in the text cited above.)
It seems remarkable that two studies that were apparently conducted on separate occasions and with different samples (unless "over 153" from the 2001 article is a very imprecise approximation of 643) should produce almost identical results. Specifically, of the 45 numbers in each table that are not calculated from the others (i.e., the numbers in the first, third, fourth, and fifth columns, with the first column having two numbers per row), 39 are identical between the two tables (and of the six others, it seems likely that the three numbers corresponding to "Light user/Average Monthly Revenue before Start" were mistyped in the 2001 version of the table, where they are identical to the numbers to their immediate left). These 39 identical "raw" numbers, plus the 17 out of 18 calculated numbers that are identical in columns 2 and 6, are highlighted in yellow in the two images above.
(*** BEGIN UPDATE 2017-03-12 20:53 UTC ***)
Jordan Anaya points out that the numbers in the third, fourth, and fifth columns of these tables were derived from the two numbers in the first column. That is, the first number in the first column is multiplied by $3.00 to give the third column; the second number in the first column is multiplied by $3.00 to give the fifth column; and the second number is multiplied by either $1.00, $0.50, or $0.25 to give the value of the coupons used.
So the number of observed values that are exactly the same across these two independent studies is "only" 17 out of 18, identical to one decimal place. (In fact the 18th, "Nonuser/Low reward/After", appears to have been mistyped in the 2001 table, given the dollar amounts on the same line, so it looks like all 18 results were actually identical.)
None of this explains why the calculated value for "Average monthly revenue/After" for "Nonuser/Moderate reward" changes between 2001 and 2003. See also the footnote under Table 4 from 2001 and Figure 3 from 2003, reproduced about six paragraphs below here.
(*** END UPDATE 2017-03-12 20:53 UTC ***)
The only point at which there appears to be a substantive difference between the two tables—namely, "Average Monthly Revenue after Program Start" and "Dollar Amount of Coupons Used" in the second line ("Nonuser", with a Program Reward Level of "Moderate")—is the explicit focus of discussion at two points in the 2001 article:
I am at a loss to explain what might have happened here. The fact that the two tables are not completely identical would seem to rule out the possibility that there was some kind of simple clerical error (e.g., including the wrong file from a folder) in the preparation of the later article.
It is also interesting to compare Table 4 of the 2001 article with Figure 3(a) of the 2003 article, the data for which appear to have been taken directly from the column entitled "Change in Purchases (in units)" in the tables just discussed. Again, the different presentations of this information suggests that this is not simply a case of adding the wrong table to the second article.
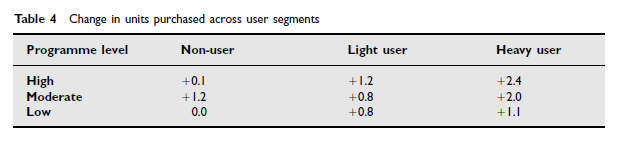

(Note here that the value for "Change in Purchases (in units)" for the "Moderate" Program Reward Level for non-users appears to have been miscalculated in both tables (it should read 1.2, not 0.2, if the numbers reported for "Average Monthly Purchases Before/After Program Start (in units)" are correctly reported). The (apparently) correct figure of 1.2 appears in Table 4 of the 2001 article, but not in Figure 3(a) of the 2003 article. Also, the "Moderate Reward Program" / "Light User" value in Figure 3a of the 2003 article appears to have become 0.9 instead of 0.8, perhaps due to different rounding in the software being used to make the figure.)
In another twist, I found what appears to be a draft version of the 2003 article here. In this draft, the table corresponding to Table 2 in the final version of the 2003 article (numbered 4 in the draft) contains the same numbers for "Nonuser" / "Moderate" as Table 5 in the 2001 article, and the effect that was noted in the 2001 article is still reported, as follows:
In summary: If the two studies in question are the same, then it would appear that there has been duplicate publication of the same results, which is not normally considered to be a good ethical practice. This is compounded by the fact that the descriptions of the participants in these two studies diverge considerably; furthermore, there is a difference between the tables across the two articles that results in the disappearance of what appeared, in the 2001 article, to be a very substantial effect (that of the moderate-reward programme for non-users). On the other hand, if the two studies are not the same, then the exact match between the vast majority of their results represents quite a surprising coincidence.
Readers who wish to explore these two articles further can find annotated versions of them here, as well as an annotated version of the draft of the 2003 article, which shows which parts of that draft did not make it into the final published article.
I have documented here what appear to be multiple varieties of duplicate publication:
A: Two hundred words for almost any situation
Here are a couple of paragraphs from the same author that have been published at least five times over a 15-year period, with just a few very minor changes of wording each time. I have copied and pasted the relevant text here so that you can see all of the different versions. (I hope the various publishers will allow this as "fair use".)
1. Wansink, B., & Ray, M. L. (1997). Developing copy tests that estimate brand usage. In W. Wells (Ed.), Measuring advertising effectiveness (pp. 359–370). Cambridge, MA: Lexington Books.
From page 361:
These two different measures of usage intent have different relative strengths. With infrequent users of a brand, volume estimates will be skewed toward 0 units (especially over a relatively short period of time). This is partially a drawback of numerical estimates that provide no gradation between 0 and 1 unit. In such cases, volume estimates would provide less variance and less information than an estimate of usage likelihood. As a result, usage likelihood estimates would allow a greater gradation in response and would be more sensitive in detecting any potentially different effects these ads might have on usage.2. Wansink, B., & Sudman, S. (2002). Predicting the future of consumer panels. Journal of Database Marketing, 9, 301–311. http://dx.doi.org/10.1057/palgrave.jdm.3240078
In contrast, with frequent or heavy users of a brand, a volume estimate is likely to be more accurate than a likelihood estimate. This is because the distribution of these volume estimates is more likely to be normally distributed (Pearl 1981). As a result, a volume estimate of one’s usage intent is likely to provide more variance and more information about the intended usage of heavy users than is a likelihood measure, which would undoubtedly be at or near 1.0 (100 percent probable). Under these circumstances, volume estimates would be a more accurate estimate of a heavy user’s usage volume of a brand.
From page 309:
[T]hese two different measures of usage intent have different relative strengths. With infrequent users of a brand, volume estimates will be skewed toward 0 units (especially over a relatively short period of time). This is partially a drawback of numerical estimates that provide no gradation between 0 and 1 unit. In such cases, volume estimates would provide less variance and less information than an estimate of usage likelihood. As a result, usage likelihood estimates would allow a greater gradation in response and would be more sensitive in detecting any potentially different effects these adverts might have on usage.3. Wansink, B. (2003). Response to ‘‘Measuring consumer response to food products’’.
In contrast, with frequent or heavy users of a brand, a volume estimate is likely to be more accurate than a likelihood estimate. This is because the distribution of these volume estimates is more likely to be normally distributed. As a result, a volume estimate of a person’s usage intent is likely to provide more variance and more information about the intended usage of heavy users than is a likelihood measure, which would undoubtedly be at or near 1.0 (100 per cent probable). Under these circumstances, volume estimates would be a more accurate estimate of a heavy user’s usage volume of a brand.
Sensory tests that predict consumer acceptance. Food Quality and Preference, 14, 23–26. http://dx.doi.org/10.1016/S0950-3293(02)00035-6
From page 25:
These two different measures of usage intent have different relative strengths. With infrequent users of a product, frequency estimates will be skewed toward 0 units (especially over a relatively short period of time). This is partially a drawback of numerical estimates that provide no gradation between 0 and 1 unit. In such cases, the frequency estimates provide less variance and less information than an estimate of consumption likelihood. With light users, consumption likelihood estimates will provide greater gradation in response and more sensitivity in detecting any potentially different effects a particular set of sensory qualities would have on consumption.4. Bradburn, N. M., Sudman, S., & Wansink, B. (2004). Asking questions: The definitive guide to questionnaire design—For market research, political polls, and social and health questionnaires (Revised ed.). San Francisco, CA: Jossey-Bass.
In contrast, with frequent or heavy users of a product, a frequency estimate is likely to be more accurate than a likelihood estimate. This is because the distribution of these frequency estimates is more likely to be normally distributed. As a result, a frequency estimate of one’s consumption intent is likely to provide more variance and more information about the intended consumption of heavy users than is a likelihood measure, which would undoubtedly be at or near 1.0 (100% probable). With heavy users, frequency estimates would be a more accurate estimate of a heavy user’s future consumption frequency of a product.
From pages 134–135:
These two different measures of behavioral intent have different relative strengths. With infrequent behaviors, frequency estimates will be skewed toward 0 (especially over a relatively short period of time). This is partially a drawback of numerical estimates that provide no gradation between 0 and 1 unit. In such cases, frequency estimates would provide less variance and less information than an estimate of likelihood. As a result, likelihood estimates would allow a greater gradation in response and would be more sensitive.5. Wansink, B. (2012). Measuring food intake in field studies. In D. B. Allison and M. L. Baskin (Eds.), Handbook of assessment methods for eating behaviors and weight-related problems: Measures, theories, and research (2nd ed., pp. 327–345). Los Angeles, CA: SAGE.
In contrast, with frequent behaviors, a frequency estimate will be more accurate than a likelihood estimate. The reason is that frequency estimates are more likely to be normally distributed. As a result, a frequency estimate is likely to provide more variance and more information than is a likelihood measure, which would undoubtedly be at or near 1.0 (100 percent probable). Under these circumstances, frequency estimates more accurately correspond with actual behavior.
From page 336:
These two different measures of intake intent have different relative strengths. With infrequent users of a food, frequency estimates will be skewed toward 0 units (especially over a relatively short period of time). This is partially a drawback of numerical estimates that provide no gradation between 0 and 1 unit. In such cases, the frequency estimates provide less variance and less information than an estimate of intake likelihood. With light users, intake likelihood estimates will provide greater gradation in response and more sensitivity in detecting any potentially different effects a particular set of sensory qualities would have on intake.You can check all of these here. In addition to the draft PDF versions that I have annotated, the first example (from the 1997 book Measuring Advertising Effectiveness) is also available on Google Books here, the fourth example (from the 2004 book Asking Questions...) is available here, and the fifth example (from the 2012 book Handbook of Assessment Methods for Eating Behaviors...) is available here. Note that in the case of Asking Questions..., the PDF is an extract from a copy of the entire book that I found when searching on Google; I hope this possible violation of copyright on my own part will be forgiven.
In contrast, with frequent or heavy users of a food, a frequency estimate is likely to be more accurate than a likelihood estimate. This is because the distribution of these frequency estimates is more likely to be normally distributed. As a result, a frequency estimate of one’s intake intent is likely to provide more variance and more information about the intended intake of heavy users than is a likelihood measure, which would undoubtedly be at or near 1.0 (100 percent probable). With heavy users, frequency estimates would be a more accurate estimate of a heavy user’s future intake frequency of a food.
B: Copying and pasting from multiple articles to make a new one
Consider this review article from 2015:
Wansink, B. (2015). Change their choice! Changing behavior using the CAN approach and activism research. Psychology & Marketing, 32, 486–500. http://dx.doi.org/10.1002/mar.20794
The image below shows the extent to which the 2015 article appears to consist of duplicated text from other publications. Everything in yellow, plus three of the four figures (which I couldn't work out how to highlight in the PDF) has been published before, some of it twice; I estimate that this represents about 50% of the article.

Specifically, parts of this article appeared to have been copied without attribution from the following works (listed in approximate descending order of quantity of apparently duplicated text):
Wansink, B. (2011). Activism research: Designing transformative lab and field studies. In D. G. Mick, S. Pettigrew, C. Pechmann, & J. L. Ozanne (Eds.), Transformative consumer research for personal and collective well-being (pp. 66–88). New York, NY: Routledge.
Wansink, B. (2013). Convenient, attractive, and normative: The CAN approach to making children slim by design. Childhood Obesity, 9, 277-278. http://dx.doi.org/10.1089/chi.2013.9405
Wansink, B. (2015). Slim by design: Moving from Can’t to CAN. In C. Roberto (Ed.), Behavioral economics and public health (pp. 237–264). New York, NY: Oxford University Press.
Wansink, B. (2010). From mindless eating to mindlessly eating better. Physiology & Behavior, 100, 454–463. http://dx.doi.org/10.1016/j.physbeh.2010.05.003
Wansink, B., Just, D. R., Payne, C. R., & Klinger, M. Z. (2012). Attractive names sustain increased vegetable intake in schools. Preventive Medicine, 55, 330–332. http://dx.doi.org/10.1016/j.ypmed.2012.07.012
Annotated versions of all of these documents are can be found here. A Google Books preview of the 2015 chapter "Slim by Design" is available here to compare with the annotated document, which is a final draft version.
C: An article apparently recycled as the basis of a book chapter, without disclosure
The article:
Wansink, B., van Ittersum, K., & Werle, C. (2009). How negative experiences shape long-term food preferences: Fifty years from the World War II combat front. Appetite, 52, 750–752. http://dx.doi.org/10.1016/j.appet.2009.01.001
The book chapter:
Wansink, B., van Ittersum, K., & Werle, C. (2011). The lingering impact of negative food experiences: Which World War II veterans won’t eat Chinese food? In V. R. Preedy, R. R. Watson, & C. R. Martin (Eds.), Handbook of behavior, food and nutrition (Vol. 1, pp. 1705-1714). New York, NY: Springer.
It appears that almost all of the 2009 research article—about 1,400 words—has been duplicated in the 2011 chapter, with only very minor changes and the omission of five sentences, which account for less than 100 words. No disclosure of this re-use appears in the book chapter. (In contrast, Chapter 87 in the same book contains, on pages 1357 and 1360, explicit acknowledgements that two passages in that chapter contain material adapted from two other previously published sources; each of these passages corresponds to about 120 words in the original documents.)
You can examine annotated versions of the article and chapter here (note that the PDF file of the book chapter is an extract from a copy of the entire book that I found on Google). The book chapter is also available on Google Books here (although three of the ten pages are missing from the preview).
Here is a snapshot of the 2009 article (left) and the 2011 book chapter (right).

D: Two almost-identical book chapters, published more or less simultaneously
There seems to be a very close resemblance between the following two book chapters:
Wansink, B. (2011). Mindless eating: Environmental contributors to obesity. In J. Cawley (Ed.), The Oxford handbook of the social science of obesity (pp. 385–414). New York, NY: Oxford University Press.
Wansink, B. (2012). Hidden persuaders: Environmental contributors to obesity. In S. R. Akabas, S. A. Lederman, & B. J. Moore (Eds.), Textbook of obesity: Biological, psychological and cultural influences (pp. 108–122). Chichester, England: Wiley-Blackwell.
Each chapter is around 7,000 words long. The paragraph structures are identical. Most of the sentences are identical, or differ only in trivial details; a typical example is:
(Mindless Eating, p. 388)
While this may appear to describe why many people eat what they are served, it does not explain why they do so or why they may overserve themselves to begin with. Figure 23.1 suggests two reasons that portion size may have a ubiquitous, almost automatic influence on how much we eat: First, portion sizes create our consumption norms; second, we underestimate the calories in large portion sizes.(Hidden Persuaders, p. 109)
While this may describe why many people eat what they are served, it does not explain why they do so or why they may over-serve themselves to begin with. Figure 6-2 suggests two reasons why portion size may have a ubiquitous, almost automatic influence on how much we eat: First, portion sizes create our consumption norms; second, we underestimate the calories in large portions.Overall, I estimate that about 85-90% of the text is duplicated, word-for-word, across both chapters.
It seems to be rather unusual to submit the same chapter for publication almost simultaneously to two different books in this way (the books were published less than six months apart, according to their respective pages on Amazon.com). One occasionally sees a book chapter that is based on an updated version of a previous journal article, but in that case one would expect to find a note making clear that some part of the work had been published before. I was unable to find any such disclosure in either of these books, whether on the first or last page of the chapters themselves, or in the front matter. I also contacted the editors of both books, none of whom recalled receiving any indication from the author that any of the text in the chapter was not original and unique to their book.
I found final draft versions of each of these chapters here and here. Each draft clearly states that it is intended for publication in the respective book in which it finally appeared, which would seem to rule out the possibility that this duplication arose by accident. Interested readers can compare my annotated versions of these final drafts with each other here. You can also check these drafts against the published chapters in the Google Books previews here and here (the first has the complete "Mindless Eating" chapter, but four pages of the "Hidden Persuaders" chapter are missing from the second). The degree of similarity is visible in this image, where yellow highlighting indicates text that it identical, word-for-word, between the two drafts ("Mindless Eating" is on the left, "Hidden Persuaders" is on the right).

E: Different studies, same introduction, same summary, different participants, same results
In 2003, when the current director of the Cornell Food and Brand Lab was still at the University of Illinois at Urbana-Champaign [PDF], he published a report of a pair of studies that had a certain number of theoretical aspects in common with another pair of studies that he had previously described in a co-authored article from 2001. Here are the two references:
Wansink, B., & Seed, S. (2001). Making brand loyalty programs succeed. Brand Management, 8, 211–222. http://dx.doi.org/10.1057/palgrave.bm.2540021
Wansink, B. (2003). Developing a cost-effective brand loyalty program. Journal of Advertising Research, 43, 301–309. http://dx.doi.org/10.1017/S0021849903030290
I estimate that the introduction and summary sections from the two resulting articles are about 50% identical. You can judge for yourself from this image, in which the 2001 article is on the left, and the 2003 article is on the right. The introduction is on the first six pages of the 2001 article and the first four pages of the 2003 article. The summary section is near the end in each case.

Perhaps of greater interest here, though, is a comparison between Table 5 of the 2001 article and Table 2 of the 2003 article, which appear to be almost identical, despite purportedly reporting the results of two completely different studies.
Table 5 in the Wansink and Seed (2001) article apparently represents the results of the second study in that article, in which a questionnaire was administered to "153 members of the Brand Revitalisation Consumer Panel" (p. 216):
As shown in Table 5, this moderate benefit programme captured an average monthly incremental gain of $2.95 from the non-user and $3.10 from the heavy user. For light users, the most cost-effective programme was the one that offered the lowest benefit package. This programme level captured an average monthly incremental gain of $2.00 from the light user. (Wansink & Seed, 2001, p. 218)

Table 2 in the Wansink (2003) article appears to summarise the results of Study 2 of that (i.e., 2003) article, which involved "a nationwide survey of 2,500 adult consumers who had been randomly recruited based on addresses obtained from census records. . . . Of the 2,500 questionnaires, 643 were returned in time to be included in the study".
The second major finding of Study 2 was that, in contrast to the beliefs of the managers, the high reward program appears to be the least cost-effective program across all three segments. Given the simple two-period model noted earlier, Table 2 shows the low reward program is the most cost-effective across all three segments ($1.67), and the moderate reward program is the most cost-effective with the heavy user ($3.10). (Wansink, 2003, p. 307)

(For what it is worth, the average gain for the low reward program across all three segments in the 2003 article appears to be ($0.00 + $2.00 + $2.00 = $4.00) / 3 = $1.33, rather than the $1.67 reported in the text cited above.)
It seems remarkable that two studies that were apparently conducted on separate occasions and with different samples (unless "over 153" from the 2001 article is a very imprecise approximation of 643) should produce almost identical results. Specifically, of the 45 numbers in each table that are not calculated from the others (i.e., the numbers in the first, third, fourth, and fifth columns, with the first column having two numbers per row), 39 are identical between the two tables (and of the six others, it seems likely that the three numbers corresponding to "Light user/Average Monthly Revenue before Start" were mistyped in the 2001 version of the table, where they are identical to the numbers to their immediate left). These 39 identical "raw" numbers, plus the 17 out of 18 calculated numbers that are identical in columns 2 and 6, are highlighted in yellow in the two images above.
(*** BEGIN UPDATE 2017-03-12 20:53 UTC ***)
Jordan Anaya points out that the numbers in the third, fourth, and fifth columns of these tables were derived from the two numbers in the first column. That is, the first number in the first column is multiplied by $3.00 to give the third column; the second number in the first column is multiplied by $3.00 to give the fifth column; and the second number is multiplied by either $1.00, $0.50, or $0.25 to give the value of the coupons used.
So the number of observed values that are exactly the same across these two independent studies is "only" 17 out of 18, identical to one decimal place. (In fact the 18th, "Nonuser/Low reward/After", appears to have been mistyped in the 2001 table, given the dollar amounts on the same line, so it looks like all 18 results were actually identical.)
None of this explains why the calculated value for "Average monthly revenue/After" for "Nonuser/Moderate reward" changes between 2001 and 2003. See also the footnote under Table 4 from 2001 and Figure 3 from 2003, reproduced about six paragraphs below here.
(*** END UPDATE 2017-03-12 20:53 UTC ***)
The only point at which there appears to be a substantive difference between the two tables—namely, "Average Monthly Revenue after Program Start" and "Dollar Amount of Coupons Used" in the second line ("Nonuser", with a Program Reward Level of "Moderate")—is the explicit focus of discussion at two points in the 2001 article:
As shown in Table 5, this moderate benefit programme captured an average monthly incremental gain of $2.95 from the non-user and $3.10 from the heavy user. (Wansink & Seed, 2001, p. 218)
Across all products, the moderate reward programme was the only programme that motivated non-users to purchase. Perhaps, the high-reward programme required too much involvement on the part of the non-user and the low-reward programme did not offer enough benefit to induce trial. The moderate-reward programme might have struck the right balance. As non-users become more familiar with the product, however, a programme with more benefits might be required to sustain interest. (Wansink & Seed, 2001, p. 220)In the 2003 article, however, the corresponding numbers for the moderate benefit programme for nonusers are much smaller, so that there is no effect to discuss.
I am at a loss to explain what might have happened here. The fact that the two tables are not completely identical would seem to rule out the possibility that there was some kind of simple clerical error (e.g., including the wrong file from a folder) in the preparation of the later article.
It is also interesting to compare Table 4 of the 2001 article with Figure 3(a) of the 2003 article, the data for which appear to have been taken directly from the column entitled "Change in Purchases (in units)" in the tables just discussed. Again, the different presentations of this information suggests that this is not simply a case of adding the wrong table to the second article.


(Note here that the value for "Change in Purchases (in units)" for the "Moderate" Program Reward Level for non-users appears to have been miscalculated in both tables (it should read 1.2, not 0.2, if the numbers reported for "Average Monthly Purchases Before/After Program Start (in units)" are correctly reported). The (apparently) correct figure of 1.2 appears in Table 4 of the 2001 article, but not in Figure 3(a) of the 2003 article. Also, the "Moderate Reward Program" / "Light User" value in Figure 3a of the 2003 article appears to have become 0.9 instead of 0.8, perhaps due to different rounding in the software being used to make the figure.)
In another twist, I found what appears to be a draft version of the 2003 article here. In this draft, the table corresponding to Table 2 in the final version of the 2003 article (numbered 4 in the draft) contains the same numbers for "Nonuser" / "Moderate" as Table 5 in the 2001 article, and the effect that was noted in the 2001 article is still reported, as follows:
Based on the survey results of Table 4, the most cost-effective program for
nonusers and heavy users offered average benefits (moderate reward program). This
program level captures an average monthly incremental gain of $2.95 from the nonuser and $3.10 from the heavy user. (Draft, p. 13)
Across all products, the moderate reward program was the only program that motivated nonusers to purchase. Perhaps, the high reward program required too much involvement on the part of the nonuser and the low reward program did not offer enough benefit to induce trial. The moderate reward program might have struck the right balance. As nonusers become more familiar with the product, however, a program with more benefits might be required to sustain interest. (Draft, p. 17)So apparently, at some stage between drafting and acceptance of the 2003 article, not only was the text describing this effect removed, but the numbers that support its existence were somehow replaced, in what became Table 2, by much smaller numbers that show no effect.
In summary: If the two studies in question are the same, then it would appear that there has been duplicate publication of the same results, which is not normally considered to be a good ethical practice. This is compounded by the fact that the descriptions of the participants in these two studies diverge considerably; furthermore, there is a difference between the tables across the two articles that results in the disappearance of what appeared, in the 2001 article, to be a very substantial effect (that of the moderate-reward programme for non-users). On the other hand, if the two studies are not the same, then the exact match between the vast majority of their results represents quite a surprising coincidence.
Readers who wish to explore these two articles further can find annotated versions of them here, as well as an annotated version of the draft of the 2003 article, which shows which parts of that draft did not make it into the final published article.
Conclusion
I have documented here what appear to be multiple varieties of duplicate publication:
- Re-use of the same paragraphs multiple times in multiple publications;
- Assembly of a new article from verbatim or near-verbatim extracts taken from other published work by the same author;
- Apparent recycling of a journal article in a later book chapter, without disclosure;
- Duplicate publication of an entire chapter almost simultaneously in two different books, without disclosure;
- Re-use of the same introduction section for two different empirical articles;
- Apparent republication of the same data, with slightly different conclusions, and different descriptions of the participants.
Pete Etchells and I have covered this story at the Guardian
ReplyDeletehttps://www.theguardian.com/science/head-quarters/2017/mar/02/fresh-concerns-raised-over-academic-conduct-of-major-us-nutrition-and-behaviour-lab
Fantastic post, and thanks to Pete and Chris for covering it.
ReplyDeleteRegarding the mystery of Table 2:
"I am at a loss to explain what might have happened here. The fact that the two tables are not completely identical would seem to rule out the possibility that there was some kind of simple clerical error (e.g., including the wrong file from a folder) in the preparation of the later article."
The only benign explanation I can think of is that at some stage, the old table was mistakenly inserted into the later article, but that someone then realized that this table no longer matched with the text describing the "key" results of the later article. Supposing that this person then checked and corrected the "key" cells of the table, but ignored all of the other cells, we would end up with the Table 2 we have now... hmm.
@Neuroskeptic: The second article doesn't discuss those changed cells at all. It doesn't say, for example, "nothing happened among Nonusers at the Moderate reward level". Your idea might just about work (in a "quite a bit of imagination required" kind of a way) if the version of the table with the salient numbers in that line, giving rise to the effect that was discussed twice, had been published second. But it wasn't.
ReplyDeleteAh sorry, I misread your post. I can't see a benign explanation.
ReplyDeleteOne other thing: is there something odd about the "Light User" Average Monthly Revenues Before Program Start, changed in the second version of the paper?
In the second version, for Light User - Heavy we have $3.90, exactly what Nonuser/Moderate revenue after program start used to be in the old version (also changed).
For Light User - Moderate we have $5.10, it used to be $1.25... both numbers have a 5 and 1 (?)
For Light User - Low we have $2.40, it used to be $0.40, so the change was just the addition of a round $2 (?)
This is probably just numeric pareidolia, but it did strike me when reading the tables.
@Neuroskeptic: I cover that in the post, in parentheses in the paragraph below the image of Table 2 from the 2003 paper. If you look at those three numbers in the 2001 table, you'll see that they are identical to the three number to their immediate left, which means that the calculated values in the last column are wrong. I'm pretty sure this was just a copy-and-paste error when preparing the 2001 table, that was later fixed. The 2003 numbers give consistent calculations for the last column.
ReplyDeleteNick, this is amazing work. Did you do all this 'by hand', or did you use some automated tools for this task? If so, I'd love to know what you used.
ReplyDelete@Matt: Everything was lovingly drawn by hand with the highlighting tool in Adobe Reader. I only just found out a couple of days ago how to do that in a colour other than yellow.
ReplyDeleteUsing a tool like TurnItIn should speed up that process, if you would ever like to do it again.
ReplyDelete@Tim, @Matt: Actually that reminds me that very early on I did ask someone to try running one of the apparently self-plagiarised documents (it might or might not be one of the ones discussed in this blog post, as there are plenty of others) through TurnItIn. The problem is that TurnItIn seems not to contain many book chapters, only articles and coursework.
ReplyDeleteGood work! Next time, don't go to all that trouble with Acrobat. One of my students made quite a useful tool that automatically highlights identical text portions in two texts: http://people.f4.htw-berlin.de/~weberwu/simtexter/app.html Click on the "i" for more information, click on "Text" to paste text in or "File" to upload a file (not PDF, unfortunately). Clicking on compare will do the coloring. You can prepare a colored PDF by clicking on the printer (and can enter information you want to have on the document). Make sure you are printing the background colors from the browser, otherwise you don't get the colors.
ReplyDeleteTurnitin can't find anything that is not in its database, and it does not have everything by far.
I'm the last person to defend Brian Wansink's methods, since it is clearly p-hacking.
ReplyDeleteHowever, this post is not at all persuasive. The reason why self-plagiarizing is unethical is that it implies to a casual observer that you are publishing two novel ideas, whereas in fact you are saying the same thing twice. In examples A,B,C,D he is simply reusing/modifying his introductions and summaries. Why is this so different than people who reuse the methods section of their papers, which is commonplace? In particular, it is extremely common for book chapters and reviews to incorporate whole figures and paragraphs from the authors previous work that would be considered plagiarized if it had been a different author. I've never seen a book chapter disclose that such-and-such a chapter is based on previously published work, since it is obvious.
The only part of this post that is correct is part E, where Wansink should issue a correction regarding the tables, or retract one of the papers.
I should also note throughout all this controversy, this form of p-hacking is completely accepted in most journals. For a nice criticism of p-hacking that recognizes that this is accepted practice and advocates change, see this paper: http://opim.wharton.upenn.edu/DPlab/papers/publishedPapers/Simmons_2011_False-Positive%20Psychology.pdf
Honestly, so far throughout this controversy, I have not seen any evidence that Wansink has done anything that is unethical or not accepted practice. You can criticize his field for allowing p-hacking, but he is simply engaging in a commonly accepted practice. We should be focusing on how to genuinely reform without resorting to shaming one particular researcher.
@AlternateView:
ReplyDelete1. Opinions about how bad self-plagiarism vary, but I doubt if a Cornell undergraduate would get away with recycling a 100-word paragraph from one term paper to the next, let alone 5,000 words. Nor do I think that it is acceptable, anywhere, to submit the same chapter to two books simultaneously. Apart from anything else, the editors of each book assign copyright of the work to the respective publishers. All of the examples shown here have been done without attribution. (Ironically, at one point in the cloned book chapters in part D of my post, there is a table that has been re-used from a previous article *with a correct acknowledgement*, so it seems that the author knew what the required action was.)
2. Sure, everybody p-hacks, but most people at least pretend that they don't dredge through datasets "every day for a for a month" until they find a pattern in the tealeaves.
3. You have also missed out an intermediate step between the p-hacking (to which Dr. Wansink admitted in his blog, although he applied another name to it) and the self-plagiarism, namely the huge number of statistical errors in the articles that we looked at in our preprint, and in Jordan Anaya's blog. There were vast numbers of impossible means, SDs, and F statistics. We didn't mention the issue of p-hacking at all in our preprint. We also found a things such as claiming in one article that the researchers had measured people's consumption of salad, with some detail as to how that was done, and then another article stating flat-out that they had not measured consumption of anything apart from pizza.
@Nick Brown:
ReplyDelete1. Rules for undergraduates are actually stricter generally than for academia. For example, most PhDs' thesis in many fields are plagiarised from their own published works, which would not be accepted in undergraduate coursework. The point of this is that the ethics (conventions, really) of self-plagarism are complex and dependant on context and field. For example, I would want to know whether Wansink's colleagues typically engage in this behavior. If so, then he simply is doing what his field does. So for example, are the other chapters in the book you cite in example B also plagiarised? That would be an interesting question. I did not see any attributes for any of the chapters in the book.
2. The fact that most people pretend and Wansink did not does not make him any less honest than everyone else, just less politically savvy. At least he is being more forthright about how his research is p-hacked, while others (as you say) are just pretending. Who really is worse?
3. I question whether Wansink really makes more statistical mistakes than others, or whether he is now subject to a detection bias, since he now more in the limelight. I hypothesize that if you subjected 10 random food scientists paper's to the same level of scrutiny you applied to Wansink's papers, you would get a similair number of errors detected.
The point I am making is that Wansink's original post and other work about p-hacking demonstrate that whole sub-fields of the social sciences clearly have poor training in statistics and therefore engage in various levels of p-hacking. We should recognize that this field is therefore very flimsy and either reform it or take the whole field with a grain of salt, rather than focusing on one researcher.
(Typed from my phone, so please excuse the errors)
"I should also note throughout all this controversy, this form of p-hacking is completely accepted in most journals. For a nice criticism of p-hacking that recognizes that this is accepted practice and advocates change, see this paper: http://opim.wharton.upenn.edu/DPlab/papers/publishedPapers/Simmons_2011_False-Positive%20Psychology.pdf
ReplyDeleteHonestly, so far throughout this controversy, I have not seen any evidence that Wansink has done anything that is unethical or not accepted practice. You can criticize his field for allowing p-hacking, but he is simply engaging in a commonly accepted practice. We should be focusing on how to genuinely reform without resorting to shaming one particular researcher. "
Thanks for the link to the Simmons et al. paper! If i understood it correctly, it shows that you can make anything "significant" with a few tricks. And they advocate that you should report all the tricks you used in your paper.
If i understood this correctly, how is reporting this going to help regarding the false-positive results that appear in the literature due to using these tricks?
@AlternateView:
ReplyDelete>>I hypothesize that if you subjected 10 random food scientists paper's
>>to the same level of scrutiny you applied to Wansink's papers, you
>>would get a similair number of errors detected.
Seriously? An average of 30 errors per paper, detectable from reading the summary statistics alone? If that's the state of food science, I guess it's probably OK to start eating lard for breakfast again.
@Anonymous:
ReplyDeleteIf it is required to report these tricks, it will become obvious to reviewers and readers that the result is p-hacked and not hypothesis driven, and less weight will be given to the result.
@Nick Brown:
You bet! I even have some statistical evidence for this. If we assume that types of statistical errors are evenly distributed throughout papers, and that (as you assume) Wansink makes more errors than others, then why didn't Stackcheck discover at least SOME of them, compared to papers by his colleagues? According to your hypothesis, I would anticipate Wansink's papers to be enriched for statcheck discoverable errors.
I should also note that other errors that you note in your preprint (e.g. granularity, misstating degrees of freedome) are quite common in my experiance.
All of this points to the conclusion that Wansink is in a crummy field and, like everyone else, doing crummy work. But it does not make him any less crummy than his colleagues! Enjoy the lard!
@Unknown:
ReplyDelete>>why didn't Stackcheck discover at least SOME of them, compared to
>>papers by his colleagues? According to your hypothesis, I would
>>anticipate Wansink's papers to be enriched for statcheck
>>discoverable errors.
I would recommend that you read up on what Statcheck can and cannot do.
Statcheck can only check statistics that are correctly formatted, inline (i.e., in the text of the article), with the test statistics, degrees of freedom, and p value. But in the case of most of the articles that we looked at:
(1) Most of the numbers we looked at are in tables - Statcheck cannot interpret those.
(2) In many cases, the F statistics are not accompanied by degrees of freedom, so they can't be checked by Statcheck. (Of course, they *should* be accompanied by the degrees of freedom, and the fact that they aren't ought already to be a red flag, but hey, it got past the reviewers, so we have to deal with what we have.)
(3) In a few cases the F/df/p combination was correct (i.e., Statcheck would have been quite happy), but the problem was that the degrees of freedom didn't match the stated sample size. Again, Statcheck cannot check that, because it requires reading an English-language sentence several paragraphs earlier in the document.
I think Statcheck is a great tool, especially for journals that insist on articles reporting the main statistics inline. But there seems to be some kind of idea out there that (1) Statcheck is an amazing AI program that can read all the numbers in an article (it can't, by a long way) and (2) if Statcheck doesn't find any problems, the article is declared totally legitimate. Statcheck doesn't work like that, and its creators have never claimed that it does. It is more or less totally inapplicable here.
In fact the main entry point to these papers was GRIM, which in turn will be more or less useless for many other cases (I occasionally get requests from people who imagine that GRIM can find errors in every possible situation). And in many case, neither GROM nor Statcheck will help. Nobody has discovered a magic bullet yet.
(Just to clarify, "Unknown" above is also me "AlternateView", I just forgot to sign myself)
ReplyDelete@Nick Brown:
Your response does not undermine my main point, and I am under no delusions that any software is a magic bullet. My point here is that Wansink has come under tremendous scrutiny as an individual (such as by your work), when there is ample evidence that it is the field, not him in particular, that is rotten. This could lead to a detection bias where only Wansink is maligned if exclusively his work is examined carefully. You seem to be a person who is really motivated about this, I bet that you could conclusively demonstrate this one way or another by applying your analysis to a wider set of papers in the food science community. It would be a tremendous boon to the scientific community.
@AlternateView: I am just one person with limited time. But the techniques I'm using are very simple. So perhaps you or someone else can come up with this "ample evidence that it is the field, not him in particular, that is rotten". If you send me a couple of articles that you have your suspicions about, I will gladly give you a brief tutorial in how I look for problems.
ReplyDeleteMeanwhile, I would argue that however bad a field is, a named-chair tenured professor at an Ivy League school might be doing slightly better than average. Perhaps articles from typical food researchers average 50 statistical errors each, who knows.
@AlternateView: You've gone to great lengths to critique the work of Nick and others in this case, while also telling him to go away and do extra work. The integrity of the field is clearly important to you. Therefore, I suggest you step up and offer to do some of this work yourself. Nick and team could certainly use a helping hand. If you're not prepared to help, why not just come out and admit that you are a concern troll whose IP address is, oh I don't know, perhaps somewhere in the vicinity of Cornell?
ReplyDelete@Chris Chambers:
ReplyDeleteNick and I have a pleasant conversation (at least I thought so), so why would you assume I am a troll? I am in NYC (like millions of others, btw) but not at Cornell.
My point here is that work like Nick's point to general problems, not just Wansink. If I get a chance, maybe I will get more involved. As Nick noted, these things take time and effort.
It is clear that Wansink is a hack, and I am not defending him. But my point is that so are many, many, many people in his field. If anything my condemnation is broader than Nick's.
It is easy to look at Nicks's (excellent, btw) work and just conclude (as the news media seems to have) that Wansink is a hack, without recognizing at least the possibility of a broader problem
@AlternativeView: I hope you decide to assist Nick and team - as I say, your input would be useful and I'm sure much appreciated.
DeleteHowever, forgive my skepticism, but I very much doubt Nick will ever hear from you. In the meantime, for a bit of fun, I've edited your most recent comment below. It makes more sense when stated this way.
"It is clear that Smith is a bank robber, and I am not defending him. But my point is that there are so are many, many, many other bank robbers out there. If anything my condemnation of bank robbing is broader than Nick's. It is easy to look at Nicks's (excellent, btw) work exposing one bank robber and just conclude (as the news media seems to have) that Smith is a bank robber, without recognizing at least the possibility of a broader problem with bank robbing."
If you want to check papers for granularity errors there is a very simple calculator available here
DeleteRegarding the question of whether it is fair to focus on Wansink: even if we assume that everyone in food science is doing exactly what Wansink (allegedly) does, it would still be fair to single him out because he is a singularly succesful and influential scientist who should know better.
ReplyDeleteLeaders are, and should be, the first to be held accountable. If you lead the field then you should lead the way in integrity.
Also regarding the focus on Wansink...
Delete@AlternativeView I've followed the whole Wansink affair since the beginning - it has been fascinating and depressing in equal parts. It is clear (to me at least) that nobody was trying to write some kind of 'take-down' piece of Wansink or the Cornell Food and Brand Lab. Rather, people only starting questioning the integrity of both when it gradually transpired that:
i) neither Wansink or Cornell University gave a shit about concerns that had been raised about scientific practices until issues became more widely discussed among academics and the media
ii) Wansink and Cornell seem most concerned with trying to save face rather than engaging with people raising concerns, taking steps to independently assess the criticisms raised, or proactively correcting the scientific record.
Wansink's latest dismissal of clear cases of self-plagarism as 're-emphasizing' are a joke and speak volumes about his attitude towards this whole situation.
I would like to thank Nick for this great piece of work. It is towards my opinion an excellent proposal of Chris Chambers that AlternateView will join the team of Nick et al.
ReplyDeleteI propose that Nick et all will sort out which journal is willing to work together with them to publish a special issue with the provisional title 'A Review of the studies of the Wansink Lab'.
AlternateView wrote on 3 March 2017 at 03:54: "most PhDs' thesis in many fields are plagiarised from their own published works, which would not be accepted in undergraduate coursework."
I am one of the 13 authors of http://onlinelibrary.wiley.com/doi/10.1046/j.0019-1019.2001.00014.x/abstract
This paper was published in January 2002. This paper is chapter 5 of the PhD thesis of the first author. The defence of this thesis was at RUG, University of Groningen, on 5 October 2007. I was at the defence of this thesis.
(1): it is clearly indicated in the contents at http://www.rug.nl/research/portal/files/2804819/00_titlecon.pdf : "Published in 2002 in Ibis 144: 122–134".
(2): it is clearly indicated at http://www.rug.nl/research/portal/files/2804824/05_c5.pdf : "Published in 2002 in Ibis 144: 122-134".
Excuse me very much, but I fail to understand how you can argue that I am an author of a plagiarised piece of work.
It is of course not excluded that your definition of plagiarism is not identical to the generally accepted definition of plagiarism. Please therefore provide me with the text of your definition of plagiarism. Thanks in advance for a response.
That sinking feeling when you start wondering if you have spent more time thinking about a paper than the authors...
ReplyDelete@Boris Barbour: This seems to happen to me quite a lot.
ReplyDeleteThe article:
ReplyDeleteWansink, B., van Ittersum, K., & Werle, C. (2009). How negative experiences shape long-term food preferences: Fifty years from the World War II combat front. Appetite, 52, 750–752. http://dx.doi.org/10.1016/j.appet.2009.01.001
The book chapter:
Wansink, B., van Ittersum, K., & Werle, C. (2011). The lingering impact of negative food experiences: Which World War II veterans won’t eat Chinese food? In V. R. Preedy, R. R. Watson, & C. R. Martin (Eds.), Handbook of behavior, food and nutrition (Vol. 1, pp. 1705-1714). New York, NY: Springer.
https://www.pubpeer.com/topics/1/5F9817C7E4B678D448448B6DACF278
cornell has now published a statement from Wansink with links to download his original data.
ReplyDeletehttp://foodpsychology.cornell.edu/research-statement-april-2017#data & scripts
Have you considered this reply to your "statistical heartburn" paper?
ReplyDeletehttp://foodpsychology.cornell.edu/sites/default/files/unmanaged_files/Response%20to%20%27Statistical%20Heartburn%27%20Overview%20FINAL.pdf
Fine to reuse method and theory descriptions, according to COPE, though I think they say some attribution is required.
ReplyDelete